Orbitt PRO Chrome Extension
Test the Trading Future. Experience first-hand how cutting-edge AI technology can streamline your trading process providing actionable insights.
Elevate Your
Trading with Informed Decisions
Orbitt PRO uniquely combines AI prowess and a convenient Chrome Extension, redefining the cryptocurrency trading experience with innovation and enhanced security.
Access
Orbitt PRO Test API
Navigate the Crypto Market with Confidence. See how effortlessly our tool integrates with your daily browsing and trading activities. Discover how our Chrome extension can revolutionize your trading strategy. Access now!*
*TheOrbitt PRO Chrome Extension will be exclusive to Orbitt token holders. Currently, the beta version is open to all, offering a preview of its capabilities.
Powerful AI Analysis
Utilizing advanced algorithms, Orbitt PRO provides in-depth insights by identifying complex chart patterns, enhancing trading strategies.
Real-Time Insights
Orbitt PRO offers real-time pattern recognition, enabling traders to make informed decisions quickly as market dynamics unfold.
Seamless Integration
Integrated with the Chrome browser, Orbitt PRO ensures access to market data and AI-driven insights without switching applications.
Orbitt PRO
AI Meets Crypto
Prompts
Navigate the Crypto Market with Confidence. Our tool seamlessly integrates with your daily browsing and trading activities, bringing comprehensive market insights and analysis right to your fingertips, enhancing your trading decisions with the power of advanced AI-driven prompts.
For Advanced Traders:
Check for bullish crossover signals on the SMA for potential entry or exit points.
Alert: Bearish divergence observed on the RSI. Consider opportunities for shorting.
Identify any breakout patterns from crucial resistance or support levels.
Monitor Stochastic RSI for momentum shifts.
Spot falling or rising wedge patterns for possible trend reversals.
Observe for significant volume changes as confirmation of trend strength.
Examine MACD lines for bullish or bearish crossovers.
Utilize the Fibonacci retracement tool to identify potential support/resistance levels.
Watch for Bollinger Band squeezes as signs of upcoming volatility.
Use Heikin-Ashi candles to understand the overall trend direction.
Assess the Ichimoku Cloud for a comprehensive view of market dynamics.
Identify head and shoulders or inverse patterns for trend reversal signals.
Look for Doji candlestick formations indicating market indecision.
Spot ascending or descending triangle formations for trend continuation signals.
Check for convergence or divergence of moving averages.
Identify cup and handle patterns signaling bullish trends.
Analyze price channel patterns for potential breakout or breakdown areas.
Look for a hammer or inverted hammer candlesticks indicating trend reversals.
Spot pennant or flag formations are continuation patterns.
Observe for double-top or double-bottom formations as reversal indicators.
For Less Advanced Traders:
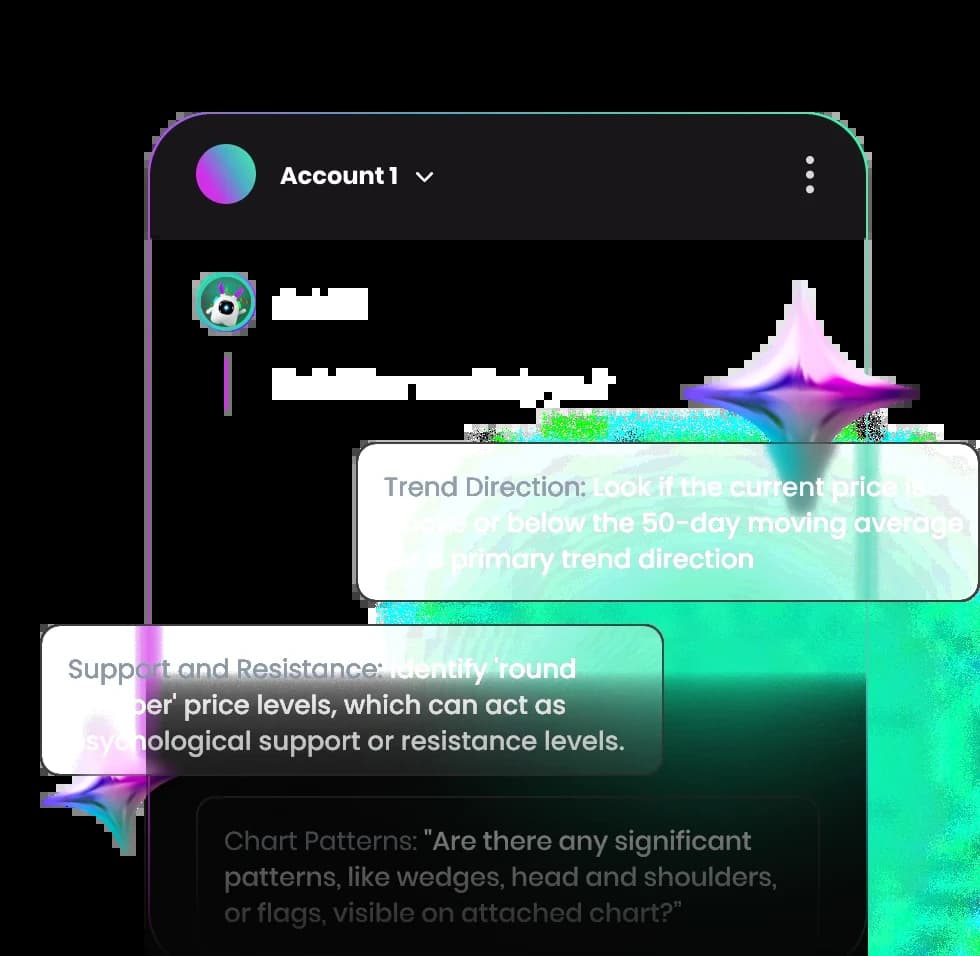
Look if the current price is above or below the 50-day moving average for a primary trend direction.
Notice large green or red candles; they often indicate strong buying or selling pressure.
See if there's a series of higher highs and higher lows for an uptrend or lower highs and lower lows for a downtrend.
Use the RSI to check if it's above 70 (potentially overbought) or below 30 (potentially oversold).
Observe any evident support or resistance levels.
Watch for a simple price crossover above or below a moving average as an essential buy or sell signal.
Notice if trading volume is increasing on up days and decreasing on down days.
Look for basic chart patterns like 'U-shapes' or 'V-shapes,' indicating potential reversals.
Check if prices consistently stay above or below the Bollinger Bands for a strong trend presence.
Identify 'round number' price levels, which can often act as psychological support or resistance levels.
For Beginner Traders:
Is the current price trend on this chart bullish or bearish?
Can you identify any significant support or resistance levels in this chart?
Does this chart show any signs of a potential trend reversal?
Are there any bullish or bearish chart patterns visible here?
What does the moving average indicate about the current trend in this chart?
Can you detect any significant volume changes that might affect my trading decision?
Is the RSI indicating overbought or oversold conditions in this chart?
Are there any candlestick patterns here that suggest a buying or selling opportunity?
Does the MACD on this chart show any convergence or divergence that I should be aware of?
Is there any indication of market sentiment shifting in this chart?
For Advanced Traders:
Check for bullish crossover signals on the SMA for potential entry or exit points.
Alert: Bearish divergence observed on the RSI. Consider opportunities for shorting.
Identify any breakout patterns from crucial resistance or support levels.
For Less Advanced Traders:
Look if the current price is above or below the 50-day moving average for a primary trend direction.
Notice large green or red candles; they often indicate strong buying or selling pressure.
See if there's a series of higher highs and higher lows for an uptrend or lower highs and lower lows for a downtrend.
For Beginner Traders:
Is the current price trend on this chart bullish or bearish?
Can you identify any significant support or resistance levels in this chart?
Does this chart show any signs of a potential trend reversal?
Orbitt PRO vs ChatGPT4
Orbitt Pro stands out against ChatGPT-4 and other general-purpose chatbots, offering a specialized approach to crypto trading.It integrates advanced, AI-driven insights and real-time market analysis directly into your Chrome browser, specifically tailored for the nuanced needs of cryptocurrency traders.
Targeted Crypto Analysis
Orbitt PRO offers specialized, crypto-focused analysis, while ChatGPT-4 provides broader AI functionalities.
Intuitive Trading Interface
Orbitt PRO is tailored for traders, with tools and indicators designed for the crypto market.
Real-Time Data
Orbitt PRO detects chart snapshots in Chrome, enabling seamless queries and interaction, a feature beyond ChatGPT-4's scope.
Enhanced Browser Integration
Orbitt PRO excels in delivering up-to-the-minute market data, essential for dynamic crypto trading.
Join Orbitt Community!
Be a part of the Orbitt Community – your hub for engaging conversations, updates, and collaboration. Connect with like-minded enthusiasts on Orbitt’s Telegram. Ready to join? Click the link and become a valued member now!
Be a part of the Orbitt Community – your hub for engaging conversations, updates, and collaboration. Connect with like-minded enthusiasts on Orbitt’s Telegram. Ready to join? Click the link and become a valued member now!